When looking at specification sheets for battery cells used in grid-scale storage systems, almost every headline number on them (capacity, cycle life, round-trip efficiency, operating temperature range, C-rate) is a rated value measured under near-ideal lab conditions.
A look across spec sheets reveals similar testing conditions dictating the spec: about 25 °C (room temperature), 4-hour charge and discharge (C/4), and “beginning of life.”
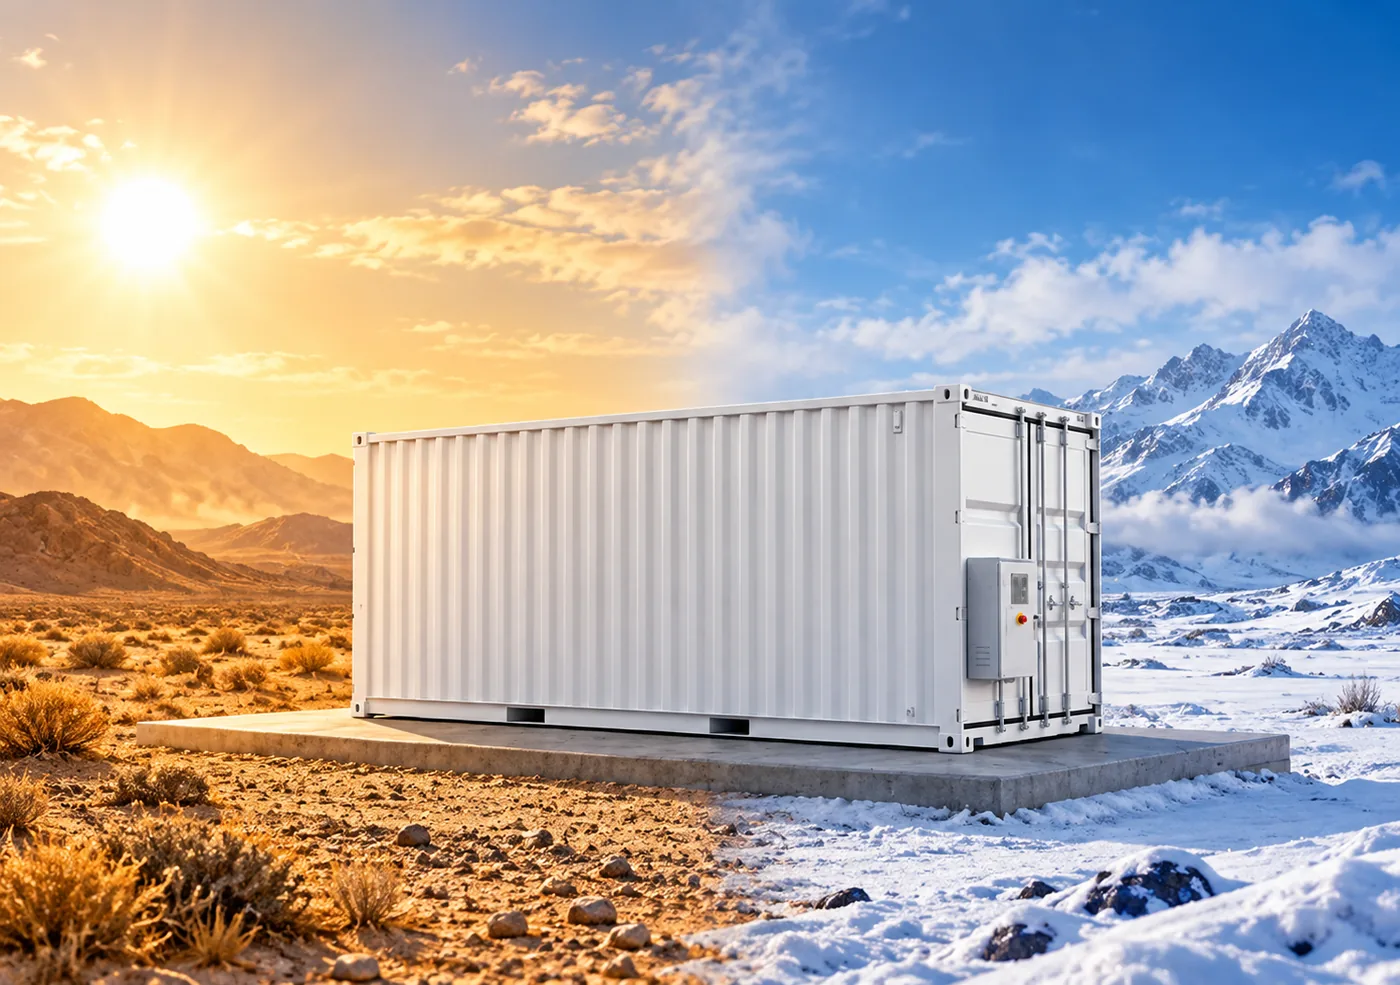
Real installed operation is different from the lab, though, and conditions are becoming more demanding as battery storage expands into new regions and applications worldwide. In the field, deployment sites can run hotter or colder, demand more intense power delivery, and require more frequent cycling than the cells see under lab conditions. Identical test conditions can be helpful for comparing similar cells apples-to-apples, but it can also be a poor predictor of how the cell will actually perform in the field.
Not only does looking beyond the rated values help to understand the real system requirements, it helps to see and compare chemistries upfront that may perform differently in the end use case. It also helps realize the value in chemistries that are significantly less sensitive to changes in real-world conditions and don’t need to be so heavily managed to get what’s listed on the cell spec sheet.
Read the number, then read its footnote
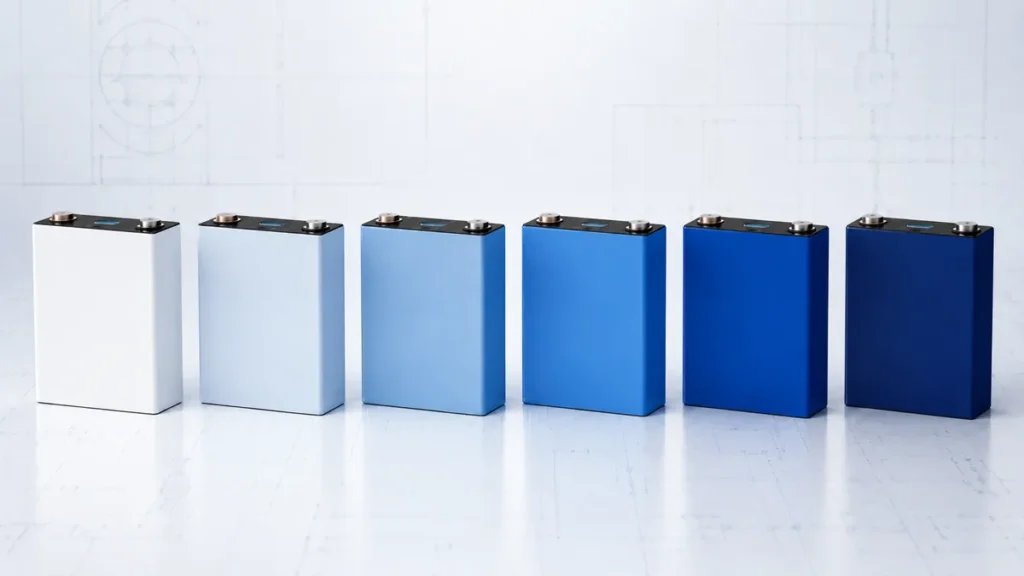
The table below shows what each spec is typically tested at for an industry-standard 280-314Ah lithium iron phosphate (LFP) 71173201 prismatic cell – and where it can experience divergence in the field.
| Spec | Typically rated at | Real-world variance |
| Rated capacity / usable energy | 25 °C, slow (~.25C – 0.5C) discharge, beginning of life | Usable capacity falls in cold weather and at high current; a nominal container MWh is not dispatchable AC energy after losses, reserves, and years of degradation |
| Round-trip efficiency (RTE) | Cell/DC “energy conversion efficiency” (~96%) at 25 °C and 0.25C | System AC-to-AC efficiency is lower — around 83–87% for grid lithium-ion — after conversion losses and continuous parasitic cooling, and it fades with age |
| Operating temperature range | Assumes cells held ~20–40 °C; charge window often narrower than discharge (e.g., 0–55 °C vs. −30–60 °C) | Outside ~20–40 °C the system spends auxiliary power heating or cooling, or derates power; cold-charging risks lithium plating |
| Cycle life | To 80% state of health at ~25 °C, ~0.5C, defined depth of discharge | Roughly halves with heat (~4,000 cycles at 25 °C to ~2,000 at 45 °C); higher C-rate cuts it further; warm sites force earlier, more frequent augmentation |
| C-rate (charge / discharge) | Peak or continuous rate at 25 °C (continuous ≠ peak); energy cells ~0.5–1C, power cells 3–5C peak | Sustained high rates lower usable capacity and accelerate aging, and generate heat (rising with the square of current) that raises cooling demand |
In a systems context, why does this matter?
Round-trip efficiency
Round-trip efficiency is revenue: every point lost is energy an operator paid to store and can’t sell back. PNNL’s grid-scale testing puts real AC-to-AC round-trip efficiency for lithium-ion systems at 83–87%, fading with age, the gap driven by power-conversion losses and cooling.
Look for round-trip efficiency that holds with little or no active cooling — every watt spent cooling cells never reaches the meter. Ensure the RTE is a guaranteed AC-to-AC number, not a cell-level DC figure, and confirm thermal-management draw is included.
Operating temperature range
Operating temperature range drives cost, throughput, and siting. A container’s rated ambient window is really a statement about how much liquid cooling it runs to hold cells near 20–40 °C — energy that never reaches the meter. Many lithium-ion cells also charge across a narrower window than they discharge (often 0–55 °C vs. −30–60 °C), because cold-charging a graphite anode plates lithium and permanently loses capacity; that forces throttled or skipped charging in cold weather, cutting throughput and revenue. Chemistries with wider passive ranges can drop the liquid-cooling loop and HVAC dependency entirely — turning BESS from what one review called “a collection of refrigerators in the desert” into simpler, more resilient assets.
Look for a wide operating range with little reliance on active heating or cooling, and a charge window as wide as the discharge window — a mismatch there is where cold-climate revenue gets left on the table.
Cycle life and design life
Cycle life is an augmentation forecast. A 20-year design life is sustained by adding capacity as cells fade, and that recurring cost moves the levelized cost of storage as much as the initial cell price — a battery that fades faster than rated needs earlier, more frequent top-ups, eating into contracted revenue-generating cycles. Ratings are measured at room temperature and a modest rate; peer-reviewed testing of LFP/graphite cells shows capacity loss accelerates sharply above that temperature, as heat speeds the loss of cyclable lithium.
Look for a cycle-life rating that holds at your site’s actual temperatures and C-rates, not just 25 °C and a slow discharge — and ask for the depth of discharge, end-of-life threshold, and augmentation schedule behind any 15- or 20-year design-life claim.
C-rate
C-rate sets how much power a battery delivers relative to its energy — and how many revenue-generating cycles it can run per day. GB fleet data shows batteries running two cycles a day earn roughly 12–14% more revenue than those running one, and markets like frequency regulation reward the fast response a higher sustained C-rate enables. The catch: sustained high C-rate cuts usable capacity and cycle life and generates heat fastest, in systems that already depend on cooling — so active cooling to support it can add an estimated 10–15% to capital cost, on top of ongoing energy use.
Look for enough thermal headroom to sustain higher C-rates without shortening service life, so multiple cycles a day are practical, not punishing.
The line items that decide siting and cost
Below the performance headlines sit the fields that set where a project can go. UL 9540A is a test method for how a fire propagates after thermal runaway begins — it measures consequences, not immunity — which is why lithium containers stack gas detection, venting, and suppression and carry strict setbacks; LFP cells included can vent hydrogen fluoride and other toxic gases when they fail. A chemistry that cannot enter thermal runaway changes that math upstream: such a chemistry is non-flammable, and by removing HVAC and fire-suppression subsystems it eliminates components representing an estimated 23–30% of total project cost. Logistics improve too — lithium cannot sit at 0 V without dissolving its copper current collector, while a chemistry stable at 0% state of charge on non-copper collectors can ship and store safely, making all of its energy usable from day one. And the supply picture favors sodium, which is roughly 1,000 times more abundant than lithium and carries no cobalt or nickel.
Compare at identical boundaries
The discipline that turns a stack of spec sheets into a real comparison is to demand guaranteed values at the same temperature, C-rate, depth of discharge, life stage, and DC-versus-AC boundary. Once you do, the winner is not the chemistry with the highest rated numbers — it is the one whose guaranteed real-world numbers sit closest to its rated ones. That is the whole case for a wide-temperature, low-degradation, non-flammable chemistry: it is engineered so the spec sheet still describes the system after it has run hot, cold, fast, and for years.
This is exactly where Alsym’s Na-Series differentiates. Its true thermal tolerance is rooted in a more robust chemistry — a polyanionic cathode that locks oxygen into a stable covalent framework and a hard-carbon anode with no cold-charge lithium-plating limit and up to 60°C operation with just passive cooling. It can sustain 2C charge and discharge without shortening cycle life, performs over 10,000 cycles (20 years) at the system level, and reaches round-trip efficiencies above >95%. Because the cell’s chemistry prevents thermal runaway (by UL9540A standards), it lets a system remove costly HVAC and fire-suppression subsystems, while also being safe to ship and store at 0% state of charge.
Explore the Na-Series specs, or ask our applications engineers to model your project’s usable energy, cycle life, and LCOS under your real-world project requirements.